
Prevalence of Childhood Overweight and Obesity
Prevalence measures how often a condition occurs in a given population during a specific time period. When comparing childhood overweight/obesity prevalence across locations and population groups, the age-range, time period, measurement method, and population characteristics should be as similar as possible.
The figures below present available prevalence data for children among a variety of subpopulations. When appropriate, comparisons are made between children in Chicago and other locations.
Scroll down to see prevalence rates
National • Chicago • Community Area Snapshots • Race and Ethnicity
On February 28, 2013, the Chicago Department of Public Health and Chicago Public Schools released a prevalence report on Overweight and Obesity for Chicago Public Schools Students – 2010-2011. This includes prevalence data for CPS students at kindergarten entry, at sixth grade, and at ninth grade. It also includes prevalence data for CPS students organized by community area. You can view the report here.
National
Updated research (2011-2015) categorizes national overweight and obesity prevalence by age groups as opposed to grade level. This research shows that the national prevalence of overweight children are as follows: 14.4% of children age 2-5, 16.5% of children age 6-11, and 14% of children ages 12-19 (Ogden et al 2015).1 The national prevalence of obese children are: 8.9% of children ages 2-5, 17.5% of children ages 6-11, and 20.5 of children ages 12-19 (Ogden et al 2014).2
Previously, overweight and obesity rates were measured in kindergarten, 6th grade, and 9th grade children nationwide.
US Child Overweight and Obesity Rates3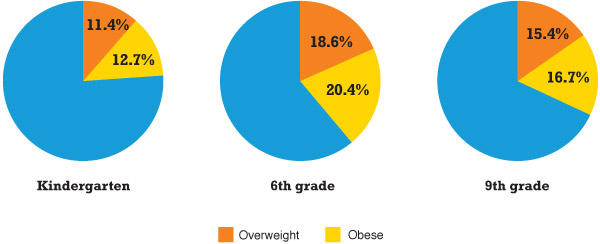
Chicago
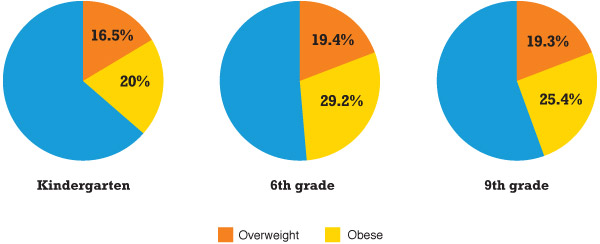
Children in Chicago have higher overweight and obesity prevalence rates than US children in the same age groups.
Chicago Child Overweight and Obesity Rates4
Community Area Snapshots
CLOCC and the Sinai Urban Health Initiative (SUHI) have worked with several Chicago communities to collect health and health behavior data.
Chicago communities for which we have data have extremely high obesity prevalence rates. The predominately white community in the sample (Norwood Park) had much lower rates compared to other communities that are predominantly Black and Hispanic.
Chicago Community Area Obesity Rates5,6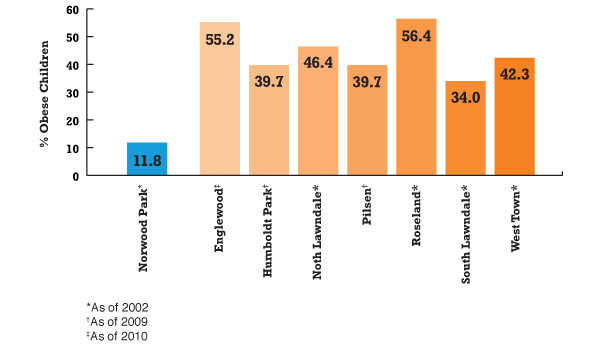
Race and Ethnicity
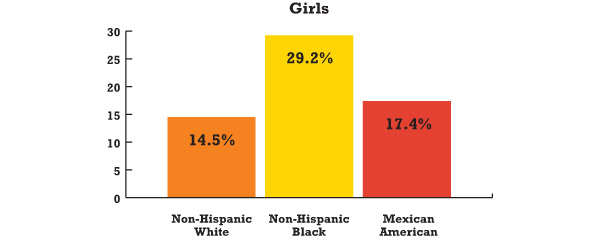
Child obesity rates in children of all ages were highest among Black and Hispanic communities for both boys and girls.
Child Obesity Rates by Race7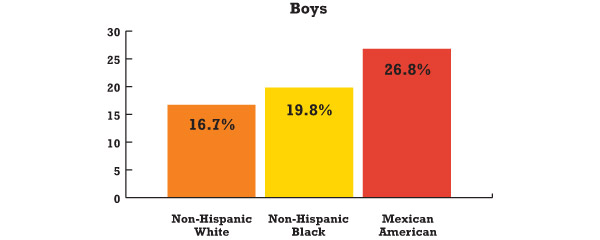
References
- Ogden CL, Carroll MD, Fryar CD, Flegal KM. Prevalence of obesity among adults and youth: United States, 2011–2014. NCHS data brief, no 219. Hyattsville, MD: National Center for Health Statistics. 2015. Available at: http://www.cdc.gov/nchs/data/databriefs/db219.pdf
- Ogden CL, Carroll MD, Kit BK, Flegal KM. Prevalence of Childhood and Adult Obesity in the United States, 2011-2012. JAMA. 2014;311(8):806-814. doi:10.1001/jama.2014.732. Available at: http://jama.jamanetwork.com/article.aspx?articleid=1832542.
- National Health and Nutrition Examination Survey (NHANES) data (2005-2010).
- Healthy Chicago: Transforming the Health of Our City. City of Chicago Department of Public Health. February 2013.
- CLOCC Community Wellness Survey 2009 and 2010.
- Margellos-Anast H., Shah AM, Whitman S. Prevalence of obesity among children in six Chicago communities: findngs from a health survey. Public Health Reports. 2008; 123(2):117.
- Cynthia Ogden, Ph.D., and Margaret Carroll, M.S.P.H., Division of Health and Nutrition Examination Surveys . Prevalence of Obesity Among Children and Adolescents: United States, Trends 1963-1965 Through 2007-2008. NCHS Health E-Stat. http://www.cdc.gov/nchs/data/hestat/obesity_child_07_08/obesity_child_07_08.htm